Agricultural Efficiency 1940 to present: Quick Data
Agricultural Efficiency.
Examination of historical data from 1940 to the present.
It has been said that the efficiency of agriculture, in the U.S., has increased since mechanization at the beginning of the 20th century. Efficiency would be the amount of product produced by the amount of employed individuals. It should include, not only farmers, but also those involved in the production of agricultural machinery and products of production as well as in the distribution of food products. By agriculture, we mean both plant and animal products.
To properly show agricultural efficiency would require data going back to 1900. The data should include total population, workforce, total employment, agriculture employment, agriculture GDP, consumer price index (CPI), and total GDP. The data which is immediately available typically goes back about a decade. For instance, the BEA provides an Excel spreadsheet of GDP data that goes back to 1998. The historical data provided by the BLS for employment goes back to 1940. Due to differences in methodology, it is not always appropriate to combine data from two different sources. As such, summary graphs for larger time periods become more difficult to produce.
A quick measure of agriculture efficiency can be gleaned from simple decade employment data provided by the Bureau of Labor and Statistics (BLS).[1] This is a table of population, workforce and employment since 1940.[2] It includes data for employment engaged in agriculture. The data includes the total civilian non-institutionalized population, the civilian labor force, the total number of people employed and the total number employed in agriculture industries. It should be highlighted that the numbers are for civilian population and do not include those in military service.
Some articles state that the current percentage of agricultural employment is 2%. This appears to be the percentage of the number of employed individuals that are employed in agriculture. This is a fine definition. The 2% value doesn’t account for children, elderly, or unemployed.
It is also useful to consider how many people it takes to feed the entire population. This figure is currently about 1%. Employment, given as a percentage of the total population, gives a better estimate of efficiency as it tells us how many people it takes to feed how many people. 1% is 1 person to feed 100 people. Recalling that this is data for the civilian population, it is a bit imprecise in that it does not include military personnel.
The decade percentage employment is shown in the graph below. An estimated curve shows that the employment data had decrease in an exponential manner. The estimate formula is [percentage employment estimate] = 0.0956 * e^( (year – 1940)/30). That it decays so nicely, with beginning and ending points that come out of seemingly nice round numbers, is a curiosity. It may also be purely coincidence, but it is memorable. It serves as a nice reference.
A more refined plot for each year is shown next. The estimate curve is the same. It does provide more information, and therefore more questions. A bump, relative to the estimate, appear at about the dates of the second world war of 1939 to 1945. Relative to the estimate, this bump occurs from 1941 to 1946. The estimate is completely arbitrary so the coincidence of the dates 1941 and 1946 are also arbitrary. Never the less, it does provide some indication of something occurring about these dates.
A bit more interpretation of the employment percentage, compared to the estimate, suggests that the trend may be some decay that is greater than a simple natural logarithm. It may be two straight segments of different slopes and connected at 1970. There are a few notable spans where efficiency has noticeably departed from our references. One is about WW II. This was noted. 1955, 1972, and the span from 1992 to 2000 are interesting.
Simple production efficiency is not necessarily the only factor that will effect the trend. Increased production efficiency likely accounts for the long term trend but the departures from this efficiency trend are not, in and of themselves, indicators of direct efficiency changes. Production is the result of numerous factors including demand. Demand can be affected by pricing. Pricing can be affected by the cost of inputs, such as demands for labor external to agriculture or increased costs of other factors such as fuel or fertilizer. Weather will create shortages which will in turn increase pricing. The U.S. also provides food product in a global market. Also, one function of production is that, given the existing efficiency due to technology, increased output has diminishing returns.
Departures from the reference lines suggest that other factors have affected the number of individual involved in production to meet the demands of the population. These graphs simply show the percentage of the total population that were employed in producing the total agricultural output of the U.S. It is a gross measure of efficiency. It is useful is gauging the long term efficiency. It is not so useful in gauging short term efficiency.
Because articles typically indicate that the percentage of employment in agriculture is 2%, for the sake of being complete, the graph below shows this trend. The reference estimate has been adjusted to match the end points.
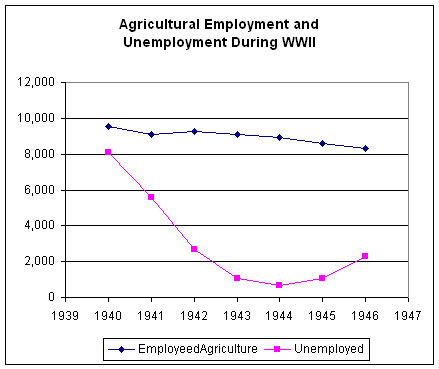
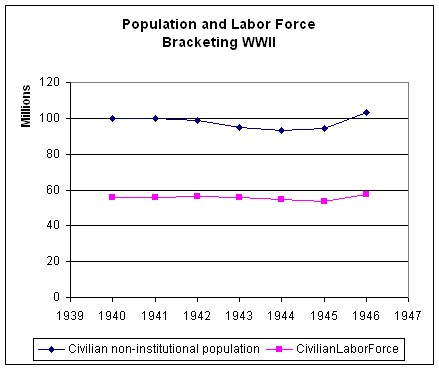
The trend is still, obviously, one of increasing efficiency. The dependent scale has changed, by a factor of about two. The curve is smoother with the notable wartime bump nearly gone. Given that military personnel are not included, this seems a big backwards. During the war, there would be fewer civilians producing food and more military consuming it. This would lead to fewer people producing food for the same amount of individuals. There are numerous confounding factors. Unemployment fell from 14% to 2% over that period of time. Population, of course, grows continuously, however modestly it was during war time. There was also a larger percentage decrease in the civilian population than there was in the civilian labor force Basically, civilian labor force went up by comparison to the civilian population. Mean while, the employment in agriculture increased during war time relative to the bracketing years. All these factors compound the values. As a result, the ratio of agricultural employment to total employment or population is inaccurate as a short term measure of efficiency.
Historical data on employment provides some relative measure of efficiency, indicating that in 1940 it took about one person person in agriculture for every ten people in the population. By 2010, this has improved by a factor of ten such that 1% of the total population is needed to feed everyone. Never the less, this measurement is not precise, lacking enough resolution to provide any short term indications of efficiency due the lack of military personnel being included or in accounting for global demand. As well, other factors such as climate, labor demand in other markets, prices, and diminishing returns on full scale production may have confounding effects.
Given the historical data of employment, from 1940 through 2010, there has been a clear, general and continuous increase in efficiency of the agriculture industry. Despite of confounding effects of complex factors the long term trend shows the fifty year efficiency to have improved by a factor of ten such that it now takes one percent of the populution to fully satisfy total demand.
[1] ftp://ftp.bls.gov/pub/special.requests/lf/aat1.txt
[2] The definition of workforce changed in 1947 from “14 years and older” to “16 years and older”. This is presented for clarity though it doesn’t have any discernable effect of the graph.


Leave a comment